Are young Australians getting bored with Facebook?

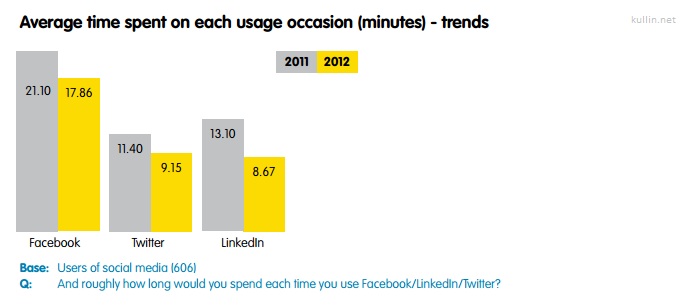
The recent IPO of social network giant Facebook is as most of you know, not going too well. The stock has dropped considerably during its first days of trading, which is also negatively affecting other listed social media brands such as Zynga. To add insult to injury, a new report from Australia reveals that young people who are on social networks are spending less time on them in 2012 than they did a year before. Average time spent on Facebook is lower this year than it was in 2011. Furthermore, more social network users predict they will decrease time spent on social media in the near future.

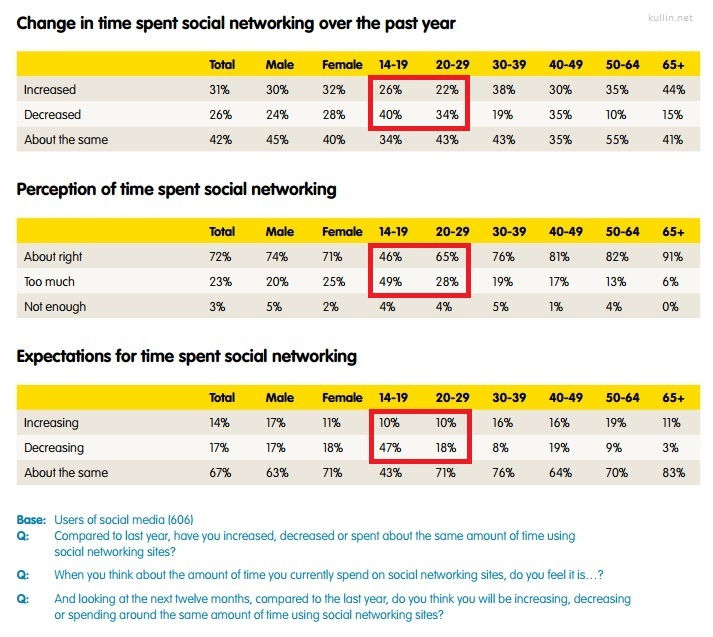
The report called The 2012 Yellow Social Media Report has surveyed Australian consumers and business to understand how they use social media. The figures below indicate that the two age groups that are the most frequent users of social networks (14-19 and 20-29), have already decreased their usage and feel they need to decrease even more.

australia-social-networks-graph

The overall numbers also show that average time spent on social networks by Austalians is far less in 2012 than in 2011.

australia-social-networks-time-spent

This is of course not a good sign for Facebook. Of course, total time spent on Facebook could still increase, but as markets mature and penetration levels out, it is vital that the average time spent on the site is not decreasing. It would be interesting to see if the pattern from Australia can be observed also in other countries. If you know of any more surveys, please post it in the comments.

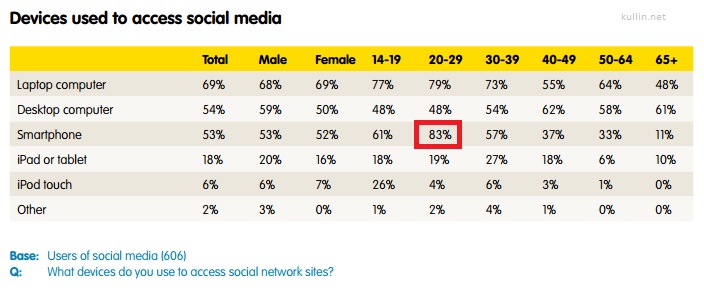
Another interesting statistic from the survey is that among users age 20-29 in Australia, the smart phone is now the number one device for accessing the social networks.

australia-social-networks device used access internet

Full report here in pdf. Bonus stat: 5% of social media users access social media on the toilet.
Predicting Eurovision based on Facebook likes – the results

I made a little experiment yesterday by trying to predict the outcome of the first Eurovision Song Contest semi-final. I used the number of Facebook likes to the country pages at Eurovision.tv and the number of views of the official videos. I was aware that it might not be the most accurate of predictions, since people can like and view a video but not vote for it due to the fact that you can’t vote for your own country and only countries competing in the semi-final could vote for the others.

Nevertheless, the overall rank I got was accurate to some degree. The countries I ranked 1-7 all got selected to the final. Then I failed with the others. The bottom three in my list, as expected, did not qualify. The tough part was the ones in the middle where the differences weren’t that big in the number of likes and views. Hungary, Moldova and Denmark eventually qualified.

The ranking based on Facebook likes was more accurate. The ten that qualified were all in my top 12 and I got all the top 7 in my list correct.

Rank: Facebook likes.

  1. Russia Q
  2. Cyprus Q
  3. Greece Q
  4. Romania Q
  5. Ireland Q
  6. Albania Q
  7. Iceland Q
  8. Finland
  9. Moldova Q
  10. Austria
  11. Hungary Q
  12. Denmark Q
  13. Latvia
  14. Israel
  15. Montenegro
  16. Switzerland
  17. San Marino
  18. Belgium

Let’s see if I can get even better results tomorrow, for semi-final 2 of the Eurovision Song Contest in Baku.

Predicting the Eurovision Song Contest with Facebook likes

On the Eurovision.tv page, each of the participants in the Eurovision Song Contest is presented with videos, images and more. Readers can share each participant’s page on social networks such as Facebook. In an attempt to predict the outcome of the first semi-final I have looked at how many times each country page has been shared on Facebook and how many times each official video has been viewed.

russia eurovison song contest photo: Thomas Hanses (EBU)

The overall score shows that Russia and Cyprus are huge favourites, while Switzerland and Belgium may not make it to the final. Late tonight, we will see how accurate these predictions are (I am aware that it is not fool proof, since you are not allowed to vote for your own country for example).

Facebook likes.

Russia: 3300
Cyprus: 2700
Greece: 2400
Romania: 2400
Ireland: 1500
Albania: 1400
Iceland: 1300
Finland: 1200
Moldova: 1000
Austria: 984
Hungary: 942
Denmark: 884
Latvia: 871
Israel: 827
Montenegro: 773
Switzerland: 629
San Marino: 553
Belgium: 275

YouTube views:

Russia: 2189000
Cyprus: 1673000
Greece: 629000
Romania: 603000
Montenegro: 598000
Albania: 464000
Austria: 454000
Iceland: 449000
Ireland: 405000
Israel: 306000
Finland: 302000
Latvia: 269000
San Marino: 258000
Hungary: 254000
Belgium: 247000
Denmark: 236000
Moldova: 183000
Switzerland: 161000

Overall rank, Facebook and YouTube:

Russia: 1
Cyprus: 2
Greece: 3
Romania: 4
Albania: 5
Ireland: 6
Iceland: 7
Austria: 8
Finland: 9
Montenegro: 10

Israel: 11
Latvia: 12
Hungary: 13
Moldova: 14
Denmark: 15
San Marino: 16
Belgium: 17
Switzerland: 18

Countries placed 1-10 will make it to the final, 11-18 are out of the competition.

Infographic: H&M vs Spotify on Twitter

H&M is the Swedish brand with most followers on Twitter. But Spotify, which is the second largest brand, creates more engagement around each tweet.

Here is an infographic that illustrates the battle for the top spot among Swedish brands on Twitter. Created with visual.ly.

Pin It

infographic-twitter

Instagram has changed the way it gives ID numbers to photos

In January I published a blog post about the growth of Instagram. I hade noticed that the unique ID numbers for photos on Instagram were handed out in a serial sequence. In other words, it wasn’t very hard to calculate the growth of the service since the data was publicly available. All you had to do was a bit of digging. For example, here is photo number 400 million: http://statigr.am/viewer.php#/detail/400000000_3849764

Update: the links to Statigram no longer work

A few weeks later, on Feb 7 to be precise, Instagram changed the ID numbers from serial sequence to what looks like a random set of numbers. As of this date, the ID numbers are determined with what I believe is called a hash function (please correct me if I got this wrong). It is no longer possible to determine the volume of uploads to Instagram by simply looking at the ID numbers.

So how do I know this changed on Feb 7? Take a look at the Instagram user “boobievsjagger“. On that day, he posted this photo:

http://statigr.am/viewer.php#/detail/686008000_10844406

According to the first part of the unique ID, this is photo number 686,008,000. The second part of that string is the ID for that user.

Later that day he published another photo:

http://statigr.am/viewer.php#/detail/120983929741434582_10844406

The first part of the ID is now replaced with 18 digits that gives us no clue to what number among the uploads this photo has. The same goes for all other images posted after Feb 7.

I predicted in my January post that Instagram would reach 1 billion uploaded photos by April this year. If you ask me, I think Instagram changed the way each photo is identified after my blog post, which was also picked up by The Next Web, among others. So now we can’t tell how fast Instagram is growing, until the company decides to tell us themselves. Let’s wait and see.

A related question is if the ID numbers for members on Instagram also will change. As it looks now, you can tell that Instagram has at least 27 million users. Here is a friend of mine that just joined: http://statigr.am/viewer.php#/user/27135093/

Infographic of 10,000 tweets

Not only have I been blogging for 8 years today. I reached another milestone just now. Since November 2007 I have tweeted 10,000 times and to celebrate this occasion I have produced this little infographic of my Twitter history. It was partially created with the service visual.ly, but about half of the content has been included manually by me.

Happy 10,000 tweets to me! You can find me on Twitter as @kullin.

infographic-kullin-10000-tweets