The impact of images on Facebook engagement

The Swedish candy producer Bubs sells a raspberry licorice candy called Hallonlakritsskalle (Raspberry Licorice Head) that is very popular on Facebook. For a while it has been one of the Swedish brands with most fans on Facebook, currently about 360,000. But getting a lot of followers is one thing, getting them engaged in your content is another. The last four months, Hallonlakritsskalle has only posted about one new update per month. On the other hand, those posts generate a lot of likes and comments.

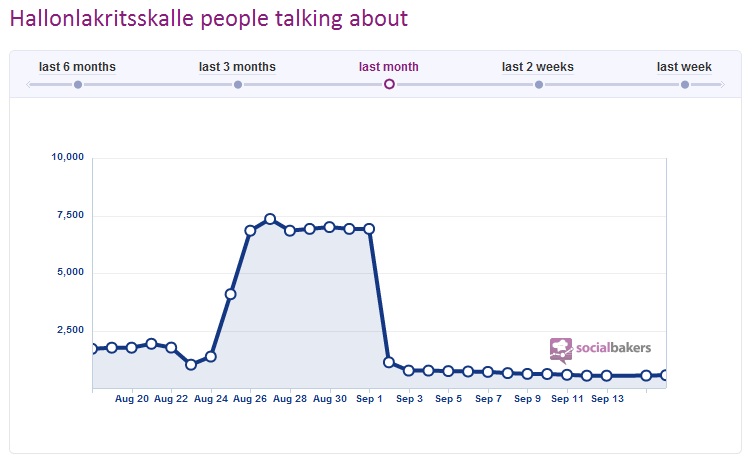
What I wanted to show was how one single creative image can spark a lot of engagement, but also that the engagement is short lived. The image below was posted on Aug 23 and generated about 5,600 likes and 100+ comments. This equals an engagement rate of 1.9% which is good, but not spectacular.

hallonlakritsskalle-facebook

But note that the engagement after the first few days plummeted and is now considerably lower than it was before the post.

hallonlakritsskalle

Keeping your fans engaged is difficult and one lucky post doesn’t take you far. Apart from being creative and relevant it also requires frequency and perseverance to keep the page going.

The dramatic growth of Instagram – reaches 5 billion twice as fast as Flickr

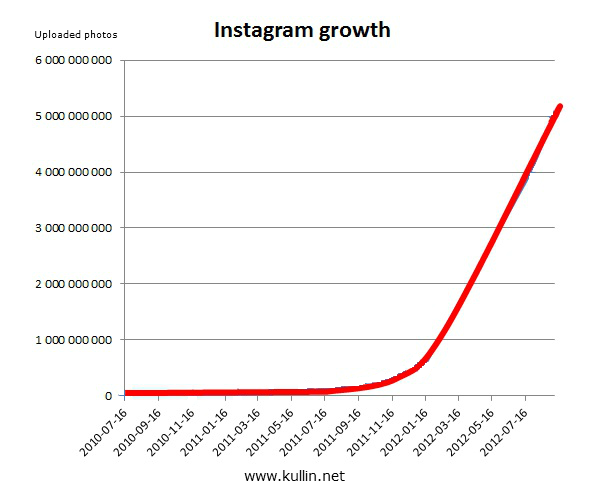
In just a little more than two years, Instagram has gone from zero to 5 billion shared photos. The popular photo sharing app announced yesterday that it had surpassed 80 million users and 5 billion photos uploaded by its users. As a comparison, it took Flickr 4 years and 7 months to reach 5 billion photos. Instagram has reached that milestone in less than half that time.

Growth in recent months has been fuelled by the release of an Android app, which went live in April 2012.

“The combination of Android and network effects as more people use Instagram mean that we’re able to grow faster now more than ever,” Instagram creator Kevin Systrom told VentureBeat in July.

To illustrate just how fast Instagram has been growing, I made the graph below based on photo ID numbers (up to 550m, when Instagram changed how photos were identified) and official statements (4bn and 5bn).

instagram growth chart sept 2012

If you want a graph with the individual data points, click here instead.

Here are the sources for each of the data points in the graph.

http://statigr.am/viewer.php#/detail/2_3
http://statigr.am/viewer.php#/detail/5000001_581545
http://statigr.am/viewer.php#/detail/25000002_1678383
http://statigr.am/viewer.php#/detail/50000000_3090267
http://statigr.am/viewer.php#/detail/100000000_2214655
http://statigr.am/viewer.php#/detail/200000000_2273481
http://statigr.am/viewer.php#/detail/300000001_8967334
http://statigr.am/viewer.php#/detail/400000000_3849764
http://statigr.am/viewer.php#/detail/500000000_733659
http://statigr.am/viewer.php#/detail/525000000_2446096
http://statigr.am/viewer.php#/detail/550000001_5785171
http://blog.instagram.com/post/28067043504/the-instagram-community-hits-80-million-users
http://blog.instagram.com/post/30996220545/instagram-and-facebook-looking-ahead-this-is-an

For a similar graph of Flickr’s growth from zero to 5 billion photos, see this blog post.

Note: I am @kullin on Instagram if you’d like to follow me.

Traffic to Pinterest increasing again

In June, I blogged about some signs that traffic to Pinterest had stopped increasing. It seemed that after the initial boom in early 2012, traffic to the site levelled out. Now there are new statistics from ComScore that confirms that Pinterest grew moderately from March to June this year and that the number of pageviews even decreased. The good news however, is that there is a significant increase both in unique visitors and pageviews in July 2012.


Via BusinessInsider.com.

Top Facebook pages in Sweden – Socialbakers report for July 2012

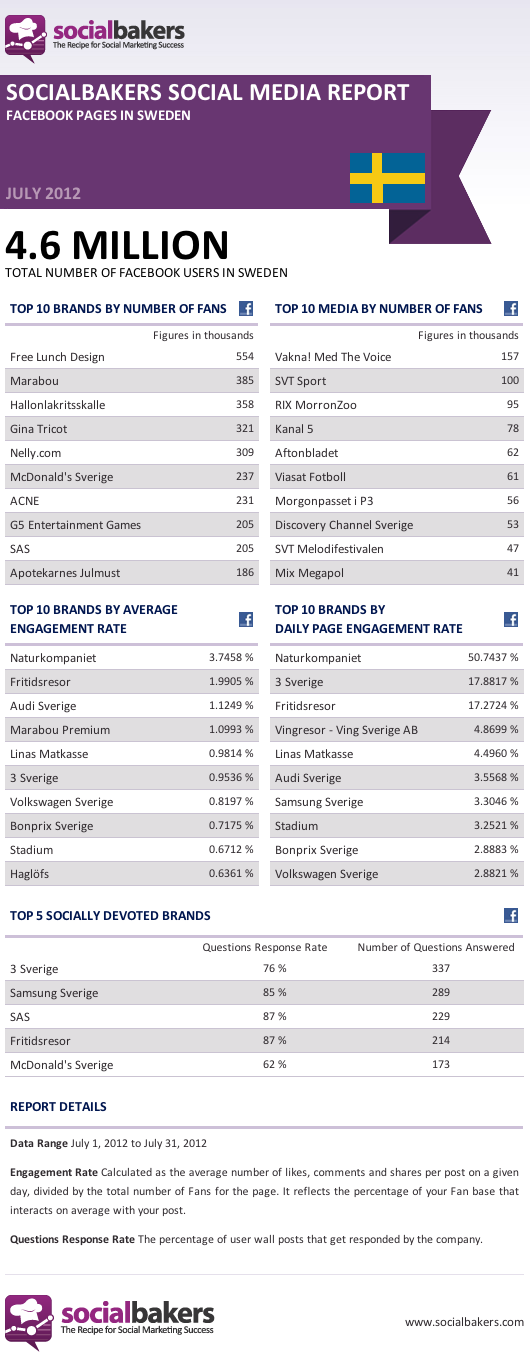
In the latest report from Socialbakers, the game developer Free Lunch Design is the Swedish brand with most fans on Facebook. As I understand, global pages such as H&M are not included in the local reports.

Vakna! med the Voice is the media page with most fans.


Top Facebook pages for Sweden July 2012 Socialbakers

There may of course be Facebook pages that are not included in Socialbakers’ database. You can suggest pages here.

How much sales does Pinterest really generate?

Do you want the recipe for the ultimate viral piece of social media content? Take one part statistics (of questionable accuracy). Add the most hyped social sites like Pinterest, Facebook and Twitter. Put the information in an infographic which you can then pin on Pinterest, blog, tweet etc. I am sure you will see a huge number of likes, retweets, repins by people who think your content is absolutely brilliant, or rather, people who are too lazy to examine the accuracy of the content. Because that is how most of us behave online these days, me included. We read something about a topic we find interesting and we share it instantly without reflecting much on whether the information is likely to be true or not.

When blogs began to appear we got all excited over the prospect that there were now an army of watchdogs out there, just waiting to bite into any piece of twisted fact, inaccuracy or lie. Transparency would rule and the world would become a great place again. Instead, the pace of social media has turned most of us into an army of watchers, often only passively looking at what others produce, only capable of amplifying a message, or worse, distorting it along the way so that what was initially a factual piece of information, becomes something erroneous. Much like a game of Chinese whispers.

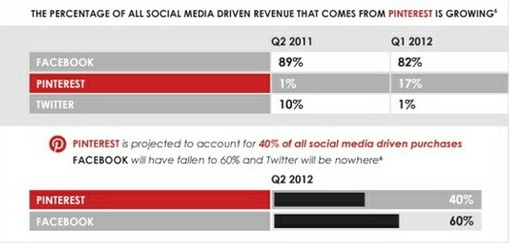
For example, do you think it is possible that Pinterest will drive 40% of all social media sales in Q2 2012? I think that sounds unlikely, but that is what this infographic is stating.
pinterest drive 40 percent of social media sales infographic

The infographic has been published by Tamba in the UK and is a few months old, but is still being passed around online, for example a post was published yesterday on Ragan.com also claiming that Pinterest is “to drive 40 percent of all social media purchases”.

To start with, what does that mean? All sales on the entire planet, or are we talking about the US? After a bit of digging I eventually found the source of this piece of data. In April, Venturebeat published an article by the CEO of Convertro, that projected Pinterest to increase its share of social media sales from 17% to 40%. But this is not for all businesses online, this data is based on “measurements we made across 40 of our client sites — most of which are top 500 internet retailers”.

So, data from an undisclosed set of 40 retailers are supposed to represent every company on the planet that sells stuff online? That is just ridiculous. You cannot make any statistical conclusions from that type of data collection other than that you will know what sites that drive sales for these 40 retailers. Typically, these kind of details are often missing when someone else uses them to make an infographic and suddenly the Chinese whisper game is on.

Besides, as I blogged some days ago, there are some signs that traffic to Pinterest has levelled out. Since there are no official statistics from Pinterest that show us if the site continues to increase, we can only guess. But if you ask me, I would not state that Pinterest drives a certain percentage of all the traffic to e-commerce sites, because we simply don’t know.

Has traffic to Pinterest plateaued?

There has been an incredible hype over Pinterest during the last six months or so, to the extent that many claim it is a must for business marketers. While I have no problem in seeing benefits with the site, a word of caution might be in place. The site grew extremely fast for some time, but will this growth continue or will users leave the network once they tried it a few times?

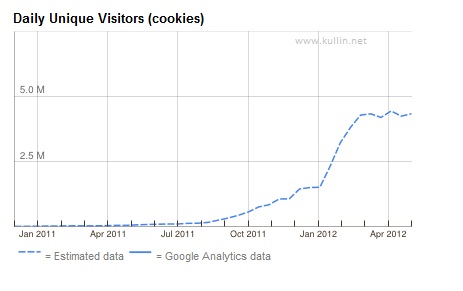
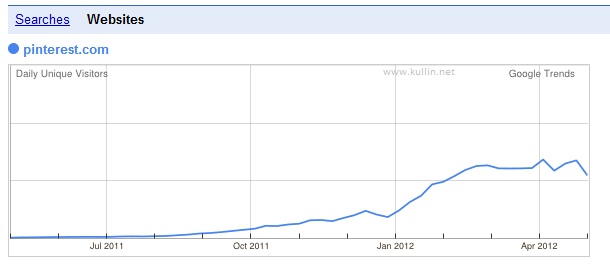
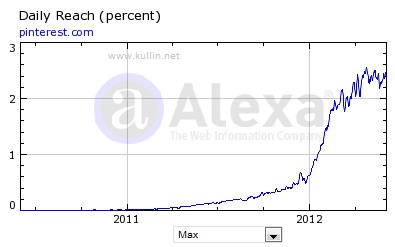
I don’t know, but take a look at the three graphs below. Although there is reason to be careful with reading too much into this statistics, it sure does look like traffic to Pinterest has stopped growing as fast as it did in early 2012, or even stopped growing at all. What do you think, are you using Pinterest as much as you did six months ago?

DoubleClick Ad Planner:

pinterest traffic graph adplanner

Google Trends:

pinterest traffic graph google trends

Alexa.com

pinterest traffic graph alexa