Top 50 brands on Facebook

The Big Money ranks the 50 brands that are currently making the best use of Facebook. The ranking is based on factors like number of fans, page growth, frequency of updates, creativity and fan engagement. Coca-Cola is ranked as the brand that makes best use of the social network thanks to its “organic fan-centric page without a corporate feel”. Here are the top 10:

1. Coca-Cola: 3,996,163 fans
2. Starbucks: 5,034,578 fans
3. Disney: 2,119,773 fans
4. Victoria’s Secret: 2,151,895 fans
5. iTunes: 2,236,306 fans
6. Vitaminwater: 1,087,153 fans
7. YouTube: 3,733,242 fans
8. Chick-fil-A: 1,221,064 fans
9. Red Bull: 1,623,102 fans
10. T.G.I. Friday’s: 974,192 fans

Swedish fashion retailer H&M; is at number 24 (1,341,742 fans). The motivation for the ranking: “The High fan interaction. The fashion retailer has had success in generating tens of thousands of responses with polls.”

It is also interesting to find the U.S. retailer Target on #43. Target took some heat in early 2008, when a PR representative responded to a blogger request like this:

“Unfortunately we are unable to respond to your inquiry because Target does not participate with non-traditional media outlets.

This practice is in place to allow us to focus on publications that reach our core guest.”

It seems that Target indeed learned from that incident.

Tags: , , , , . Ping.

Flickr reaches 4 billion photos

The photo sharing site Flickr today reached 4 billion photos. The growth continues to be steady and over the last 2.5 years the site has grown with half a billion new photos every six months.

Photo number 4,000,000,000 can be viewed here.

Previous milestones for Flickr:

22 Oct 04: 1,000,000
20 Apr 05: 10,000,000
15 Feb 06: 100,000,000
22 Sep 06: 250,000,000
15 May 07: 500,000,000
19 Jul 07: 850,000,000
06 Oct 07: 1,500,000,000
13 Nov 07: 2,000,000,000
17 May 08: 2,500,000,000
03 Nov 08: 3,000,000,000
04 May 09: 3,500,000,000
11 Oct 09: 4,000,000,000

Tags: , , , . Ping.

10 most popular Swedish businesses on Twitter

Swedish-businesses-on-twitter

More and more Swedish businesses are joining Twitter. In a recent study (in Swedish), I checked the corporate accounts with most followers and came up with this top ten list. The graph above was updated today and the company with most followers is Spotify, followed by H&M;.

Although it’s good to have a large following, of course the number of followers is not everything. Equally important is how the accounts are managed and if companies are engaging in conversations with others.

In the study I found that the active companies are actually quite good at maintaing a dialogue with followers. Roughly speaking, 80% of the tweeting companies post updates about news or announcements. Almost as many, 74% use Twitter to respond to feedback, answers questions or handle customer complaints. 32% use it for promotions and 6% use Twitter for rectruiting/HR purposes. This is quite a contrast to the notion that a large portion of tweets are pointless babble. At least businesses are trying to add meaningful information to Twitter.

Footnote: Stardoll and Ericsson Labs were not included in the initial analysis, but were added today. Hat tip to @beantin for the pointer to Ericsson Labs.

Update: A list of more than 160 Swedish corporate Twitter accounts can be found here. Feel free to add to the wiki.

Update Oct 8: Added Adland to the top list. Thanks @dabitch.

Tags: , , , , , . Ping.

Three Swedish blogs on AdAge Power 150

Here is a new analysis of the AdAge Power 150 list, broken down into country of origin and with a focus on non-US blogs. I haven’t blogged that frequently the last few months, so my rankings have been slipping. Still it’s great to see that Adland, Blog of Ronnestam and Media Culpa defend the Swedish colours, placing Sweden among the top non-English language countries.

AdAge Power 150 is a ranking of the world’s most influential marketing blogs.

Tags: , , , , , . Ping.

Participation in social media increases but Sweden is lagging the US

Forrester Research has just published its third annual study about consumers’ participation in social media. The data from the US is available and indicate that the digital divide is closing. Consumers who are participating the most in social technologies are labelled Creators, Critics and Collectors and all three groups have either grown moderately or are at the same level as last year. Instead the inexperienced groups called Joiners and Spectators grew rapidly. As many as 73% of online Americans are now in the group Spectators, which means that they read blogs, listen to podcast or watch videos from other users.

The inactive group decreased from 25% to 18% of the online US population.In the age group under 35 only 10% are Inactive.

social ladder by Forrester

According to the research data for Europe, “The Netherlands and Sweden have the most participation, Italy has the most Creators, and social networks are most popular in the UK.” But Sweden and Europe is still lagging the US. A comparison between Sweden and the US looks like this:

socialladdersweden

Participation in social technologies are growing fast and as author Josh Bernoff at Forrester writes: “Marketers, if you’re not doing social technology applications now, you’re officially behind.”

You can also check the data for individual contries on this widget.

Tags: , , , . Ping.

Hey TechCrunch, Sweden is not the worst greenhouse gas emitter

Tjörn bridge, Sweden. Photo: Fredrik Stålhandske, Sweden.se 2008

A blogger writes a provocative post with claims that turn out to be completely false. It happens every day, why should I care? Well, if the blog in question is no other than TechCrunch, things start to get a bit problematic. The site is so influential that its content reaches many thousands of people. As you may have read in my previous post, TechCrunch posted an article on July 31 claiming that Sweden and Canada are among the worst emitters of greenhouse gases in the world. This turned out to be at least partly bogus but TechCrunch shows no interest in correcting the misleading information.

Actually I don’t really care if people lose trust in TechCrunch, but when disinformation about my country keeps on spreading across the web, I feel I need to raise my voice. The false article is bad enough, I could live with that. But due to the authority of TechCrunch and the behaviour of its readers, the false statements continue to have an impact for a very long time. Here’s why:

– As seen on Techmeme, Twitter users are still retweeting links to the article so the lies keep reaching new people. In total at least 220 retweets so far.

– The article has been dugg 110 times on Digg and I’m sure it has been shared on many other different platforms during the last few days.

– All this sharing helps place this story high on Google. For instance, in a search for “worst country greenhouse gas” the TechCrunch article comes up first. A search for “Sweden greenhouse gas” shows the article on top as a news result, with three more mentions in the first ten results. There is an obvious risk that the false facts will stay around and influence people’s opinions and views about Sweden.

There is really no need to add more proof, all the arguments and links are clearly available in the comments to the TechCrunch article. But just to point out how ridiculous statements like “So who are the worst offenders? Topping the list is Sweden!” are, I have compiled two tables below.

As TechCrunch actually noted further down in the article, USA is the country among the 42 in the report that emits most greenhouse gases. But a more fair comparison of course is to look at how much gas each country emits per capita. So I took the liberty of compiling a table of the 42 countries, based on the total emissions for 2006. Population numbers from the Population Reference Bureau (pdf).

tc1

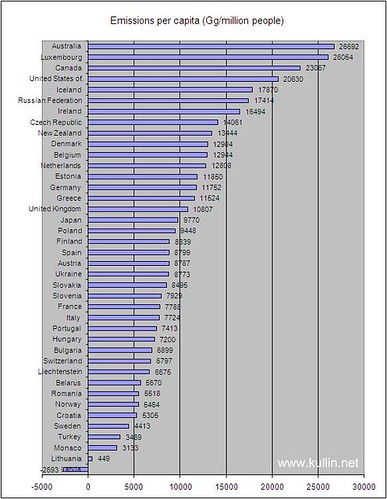
The tables show that Australia is topping the list, which is due to a high reliance on coal to generate electricity. The US is in the top along with Canada, with Sweden at the very bottom.

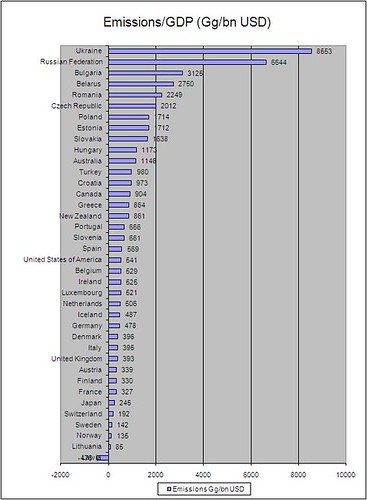
Another way to illustrate how much greenhouse gas a country emits is by looking at the amount of emissions divided by GDP. That could illustrate the ability of a country to generate wealth with a small impact on the global environment.

In the following table, countries in Eastern Europe are the worst, while again Sweden is at the very bottom.

tc2

If you feel like I do, please continue to comment the article. You can also blog about greenhouse gas emissions and link to a trusted source (like some of the links above) so that the correct information climbs in the Google results. You can tweet about the story and include the hashtag #techcrunchfail.

Don’t sit back and let this insult stand unchallenged.

Additional links:
Sweden does the most of any country for tackling emissions of greenhouse gases.

Updated Swedish data: (zip file).

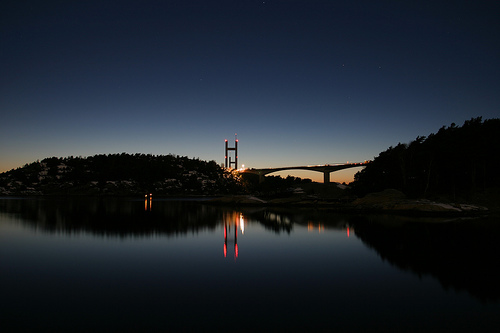
Photo credit: Fredrik Stålhandske, Sweden.se 2008

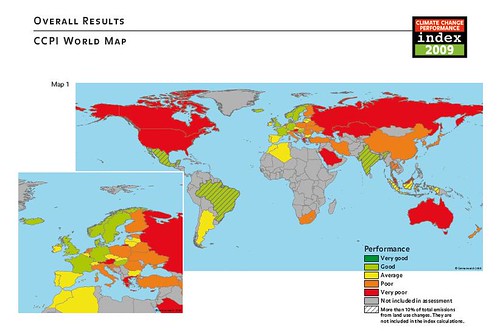
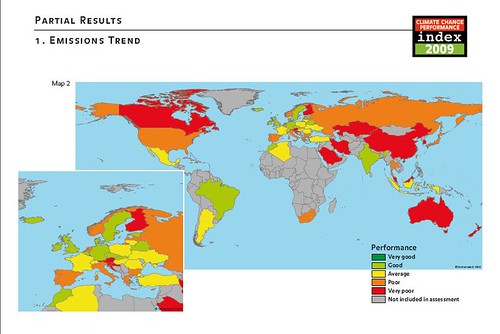
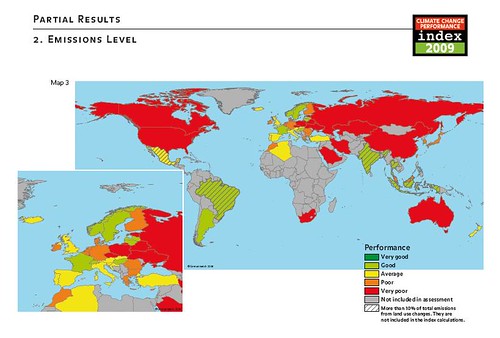
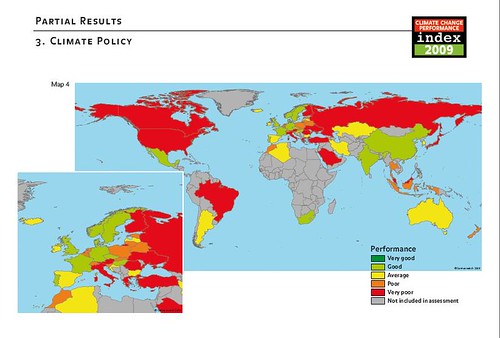
Updated with graphs from Sweden tops the Climate Change Performance Index 2009 (pdf).

climateindex09a
climateindex09b
climateindex09c
climateindex09d

Tags: , , , , , , , . Ping.